The Nature letter
OK, here is the paper that appeared in Nature. I have read and understood the paper, but I have not proof-read this post, and I apologize for the formatting, and that some of the scientific notation did not translate (e.g. the 'plus-or-minus' sign). I have pasted the figures in almost at random. Use at your own risk.
letters to nature
NATURE |VOL 433 | 6 JANUARY 2005 |www.nature.com/nature
© 2005 Nature Publishing Group
..............................................................
b-Lactam antibiotics offer
neuroprotection by increasing
glutamate transporter expression
Jeffrey D. Rothstein1,2, Sarjubhai Patel1, Melissa R. Regan1,
Christine Haenggeli1, Yanhua H. Huang2, Dwight E. Bergles2, Lin Jin1,
Margaret Dykes Hoberg1, Svetlana Vidensky1, Dorothy S. Chung1,
Shuy Vang Toan1, Lucie I. Bruijn3, Zao-zhong Su4, Pankaj Gupta4
& Paul B. Fisher4
1Department of Neurology, 2Department of Neuroscience, Johns Hopkins
University, Baltimore, Maryland 21287, USA
3The ALS Association, Palm Harbor, Florida 34685, USA
4Columbia University Medical Center, College of Physicians and Surgeons,
Department of Pathology, Neurosurgery and Urology, New York, New York 10032,
USA
............................................................................................................................................................................
Glutamate is the principal excitatory neurotransmitter in the
nervous system. Inactivation of synaptic glutamate is handled by
the glutamate transporter GLT1 (also known as EAAT2; refs 1, 2),
the physiologically dominant astroglial protein. In spite of its
critical importance in normal and abnormal synaptic activity, no
practical pharmaceutical can positively modulate this protein.
Animal studies show that the protein is important for normal
excitatory synaptic transmission, while its dysfunction is implicated
in acute and chronic neurological disorders, including
amyotrophic lateral sclerosis (ALS)3, stroke4, brain tumours5
and epilepsy6. Using a blinded screen of 1,040 FDA-approved
drugs and nutritionals, we discovered that many b-lactam antibiotics
are potent stimulators of GLT1 expression. Furthermore,
this action appears to be mediated through increased transcription
of the GLT1 gene7. b-Lactams and various semi-synthetic
derivatives are potent antibiotics that act to inhibit bacterial
synthetic pathways8. When delivered to animals, the b-lactam
ceftriaxone increased both brain expression of GLT1 and its
biochemical and functional activity. Glutamate transporters
are important in preventing glutamate neurotoxicity1,9–11.
Ceftriaxone was neuroprotective in vitro when used in models
of ischaemic injury and motor neuron degeneration, both based
in part on glutamate toxicity11.When used in an animal model of
the fatal disease ALS, the drug delayed loss of neurons and muscle
strength, and increased mouse survival. Thus these studies
provide a class of potential neurotherapeutics that act to modulate
the expression of glutamate neurotransmitter transporters
via gene activation.
Figure 1 Screen of 1,040 FDA-approved drugs revealsb-lactam antibiotics as inducers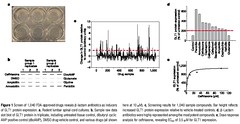
of GLT1 protein expression. a, Rodent lumbar spinal cord cultures. b, Sample raw data
slot blot of GLT1 protein in triplicate, including untreated tissue control, dibutyryl cyclic
AMP positive control (dbcAMP), DMSO drug vehicle control, and various drugs (all shown
here at 10mM). c, Screening results for 1,040 sample compounds. Bar height reflects
increased GLT1 protein expression relative to vehicle-treated controls. d, b-Lactam
antibiotics were highly represented among the most potent compounds. e, Dose response
analysis for ceftriaxone, revealing EC50 of 3.5mM for GLT1 expression.
To identify compounds capable of increasing rodent GLT1
expression, a structurally diverse library of 1,040 FDA-approved
drugs and nutritionals were individually added to organotypic
spinal cord slice cultures prepared from postnatal day 9 rats
(Fig. 1a). This approach mimics the cellular metabolism and cell–
cell interactions present in vivo. All assays were conducted in a
blinded fashion, and each drug (100mM, added biweekly) was
studied in duplicate or triplicate (10–15 tissue samples per drug).
After 5–7 days of drug treatment, tissue was harvested and immunoblotted
for expression for GLT1 protein using GLT1 anti-peptide
antibodies (Fig. 1b). Dibutyryl cyclic AMP, a GLT1 gene activator,
served as a positive control (Fig. 1b), while 0.1% DMSO controlled
for drug solubilizer. Approximately 50–60 drugs per week were
investigated. GLT1 protein was analysed by semiquantitative, semiautomated
densitometry. Replicate variability was less than 10%.
Over 20 compounds were capable of increasing GLT1 protein
expression by more than twofold compared to untreated controls
(Fig. 1c). Analysis of the top 2% of all hits revealed that a single class
of compounds,b-lactam antibiotics, was overly represented. Fifteen
different b-lactam antibiotics, including penicillin and its derivatives,
as well as cephalosporin antibiotics, were highly active in
stimulating GLT1 protein expression (Fig. 1d). Increased expression
could be seen as early as 48 h after drug treatment. Validation of
the most active drugs was confirmed by repeat treatment of
spinal cord cultures with 10–100mM drug. The EC50 for increasing
GLT1 expression by a representative cephalosporin, ceftriaxone,
was 3.5mM (Fig. 1e), which is comparable to the known central
nervous system (CNS) levels attainable with therapy for meningitis
(0.3–6mM)12,13. Non-b-lactam antibiotics included in the screen
had no effect on GLT1 protein expression, including kanamycin,
fluconazole, minocycline, polymyxin and doxycycline.
To better understand the mechanism of action, the effect of the
drugs on the GLT1 promoter was examined in cell lines from astrocytes and non-neuronal tissues.
Figure 2 Promoter reporter analysis.b-Lactams activate human GLT1 promoter. a, In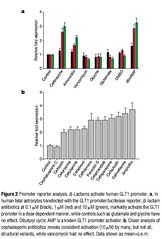
human fetal astrocytes transfected with the GLT1 promoter/luciferase reporter,b-lactam
antibiotics at 0.1mM (black), 1mM (red) and 10mM (green), markedly activate the GLT1
promoter in a dose dependent manner, while controls such as glutamate and glycine have
no effect. Dibutyryl cyclic AMP is a known GLT1 promoter activator. b, Closer analysis of
cephalosporin antibiotics reveals consistent activation (10mM) by many, but not all,
structural variants, while vancomycin had no effect. Data
shown as mean+s.e.m.
A 2.5-kilobase (kb) fragment
of the human GLT1 promoter linked to firefly luciferase was
transfected into human fetal astrocytes7, and used to screen the
active compounds identified above. Similar results were also
obtained using stable cell lines of human fetal astrocytes or COS7
cells transfected with a 2.7-kb GLT1 promoter fragment linked to
both enhanced green fluorescent protein (eGFP) complementary
DNA and firefly luciferase cDNA. As shown in Fig. 2a, the human
GLT1 promoter fragment was significantly activated by ceftriaxone,
amoxicillin and dibutyryl cyclic AMP, but not by the antibiotic
vancomycin, amino acids glutamate and glycine, or the vehicle,
DMSO. These effects were dose dependent, seen as early as 48 h after
drug administration, and persisted for at least 7 days in vitro
(Fig. 2a). Additional analysis of various cephalosporins (10mM)
and b -lactams revealed prominent activity among the various
agents (Fig. 2b), although the parent structure, cephalosporin C,
was inactive in astroglial cell lines. No b-lactams were found that
inhibited promoter activation.
As these compounds were capable of activating the promoter at
concentrations known to be attainable in brain after parenteral
administration (for example, 10–150mM)14, we further explored the
in vivo biological activity of ceftriaxone in normal rats. After five to
seven days of ceftriaxone therapy (200 mg per kg, i.p. daily, n 1/4 5),
animals were killed and brain tissue collected. Antibiotic treatment
led to a threefold increase in GLT1 protein expression, and active
splice variant GLT1b (ref. 15), as determined by semiquantitative
immunoblots from hippocampus and spinal cord (Fig. 3a, b). This
increase was persistent, and could also be observed after 3 months of
treatment (n 1/4 10). Conversely, the other molecular subtypes of
glutamate transporters, including the astroglial protein GLASTand
the neuronal glutamate transporters EAAC1 and EAAT4, were
unchanged after ceftriaxone administration (Fig. 3a, b).
GLT1 promoter activation was also observed in vivo (Fig. 3c, left
panel). Chronic treatment of GLT1-BAC-eGFP promoter reporter
mice with ceftriaxone produced an obvious increase in reporter
expression in astroglial soma and processes throughout the hippocampal
CA1 neuropil (Fig. 3c, right panel). Notably, in this brain
region neuronal expression of the gene was not induced by drug
(Fig. 3c, right panel). The effects of ceftriaxone appeared to be
relatively specific, as the constitutive proteins actin (Fig. 3a) and
superoxide dismutase 1 (SOD1, not shown), neuronal specific
proteins neurofilament L and synaptophysin, and the astroglial
protein glial fibrillary acid protein (GFAP), were unaffected by
ceftriaxone therapy. Treatment with non-b -lactam antibiotics
including vancomycin and minocycline had no effect on brain
GLT1 levels.
Glutamate transporters are preferentially localized to astroglial
membranes, although in some cases, increased protein expression is
not always mirrored by concomitant membrane localization and
functional activity16. However, cephalosporin therapy did increase
biochemical glutamate transport, as measured by L-[3H]glutamate
uptake into cortical membrane (Fig. 3d) or spinal cord (not shown)
homogenates prepared from adult animals treated intraperitoneally
for 7 days with drug. Similarly, after 7-day treatment, ceftriaxone
increased GLT1-mediated L-[3H]-glutamate transport in a dose
dependent fashion in cultured spinal cord slices (Fig. 3d). The
increase in cell surface GLT1 was confirmed with cell membrane
impermeant biotinylation reagent (Fig. 3e). Biotinylated GLT1 was
increased on plasma membranes from mixed cortical neuron/
astroglial cultures treated for 7 days with ceftriaxone. Finally,
glutamate-transporter-associated currents tended to be larger in
hippocampal astrocytes following 4–7 days of treatment of postnatal
rat pups with ceftriaxone (Supplementary Data). Thus, in vitro
and in vivo administration of ceftriaxone led to a threefold increase
in protein levels and a comparable increase in GLT-1 specific
biochemical and electrophysiological transport. Penicillin treatment
also increased biochemical transport (Fig. 3d), although its
brain penetration is less, presumably accounting for the lower level
of activity. Vancomycin was inactive in these functional assays.
Glutamate receptor antagonism has been extensively explored in
acute and chronic neuroprotection, but no therapies exist to
modulate glutamate-mediated injury via transporters. Genetic
overexpression of transporters in transgenic mice and in engineered
cell lines suggest that increasing the density of transporter in
astroglia can be neuroprotective17. The level of neuroprotection
may depend on the magnitude of overexpression. To determine if
b-lactam antibiotics, ceftriaxone in particular, could be neuroprotective,
we tested the compound in a series of in vitro and
in vivo models. Treatment of cultured neurons with a low oxygen,
low glucose condition, known as oxygen glucose deprivation
(OGD), models the neuronal injury that can occur in ischaemic
injury. In this model, one hour of OGD was lethal to cultured
neurons, with toxicity known to involve excess glutamate18. However,
when cultures are preconditioned 24 h before the lethal
condition with transient OGD (5 min), there is a dramatic and
robust resistance of neurons to cell death. This neuroprotection,
referred to as ischaemic pre-conditioning, is due in part to increased
expression of GLT1 (ref. 18), although some studies suggest these
transporters could contribute to ischaemic injury2. As shown in
Fig. 4a, baseline neuronal death in the cultures was 14% (no
treatment column, NT). Ceftriaxone (1mM), when added for 48 h
to cultures, did not increase the baseline cell death (NTþceftriaxone),
but increased GLT1 protein levels (.25%; not shown) and transport.
Cultures subject to 1 h OGD, without preconditioning,
increased neuronal death to 50%. Ischaemic preconditioning
OGD (5min) applied 24 h before a one-hour OGD prevented
neuronal injury. Importantly, 1mM ceftriaxone (or the b-lactam cefuroxime, not shown), when added 48 h before 1 h OGD, was also
protective, reducing the percentage of neuronal cell death from 50%
to 20%—similar to ischaemic tolerance neuroprotection. Thus blactam
pre-treatment appeared to prevent neuronal death in
ischaemic tolerance.
Chronic blockade of glutamate transport in spinal cord organotypic
cultures, with the non-specific transporter inhibitor threo-bhydroxyaspartate
(THA) or DL-threo-b -benzyloxyaspartate
(TBOA)11 leads to chronic increase in extracellular glutamate
and subsequent slow death of motor neurons. To determine if
ceftriaxone-induced GLT1 overexpression could be neuroprotective,
we examined motor neuron degeneration in the organotypic
spinal cord model. Organotypic cultures were prepared from
lumbar spinal cords of 8–9-day-old rodent pups11. No drugs were
added for the first 7 days following culture preparation. Then
ceftriaxone (1–100mM) was added with media changes, and after
7 more days, THA or TBOA were added at a concentration
of 100m M, which produces chronic death of motor neurons.
After 2–4 weeks, cultures were immunostained for neurofilament
to quantify large ventral horn motor neurons. As shown in Fig. 4b,
ceftriaxone treatment prevented motor neuron loss in a dose
dependent manner. Similar neuroprotective results were seen with
penicillin (not shown). As an additional control, organotypic spinal
cord cultures prepared from GLT1-null mice were not protected
from THA toxicity by ceftriaxone pre-treatment (Fig. 4b). Vancomycin
was not protective.
To determine if ceftriaxone could alter neurodegeneration in a
disease model that involves altered expression of glutamate transporters,
we treated G93A SOD1 mice with drug. Studies have
documented a contributory role for excess glutamate in this
model, including neuroprotection by glutamate receptor blockade11,19
–21. Modest GLT1 overexpression can alter disease progression17.
Guo et al17 reported that a 1.5–2.3 fold increase in Nmyc
labelled human GLT1 expression in G93A SOD1 mice delayed
disease onset as measured by grip strength (,14 days), but had no
effect on other onset parameters such as weight loss and paralysis
(3 days), and had no effect on survival. Initiating drug treatment in
this animal model around the time of clinical disease onset at, for
example, loss of strength, most closely matches the use of human
therapy, and could be more therapeutically relevant22. G93A SOD1
mice were treated daily with ceftriaxone (200 mg kg21 i.p.) starting
at 12 weeks of age—approximately the time of clinical disease onset.
Drug-treated animals (n 1/4 20) and saline-injected controls
(n 1/4 20) were monitored daily for survival, and weekly for grip
strength and body weight22,23. As shown in Fig. 4c, d, ceftriaxone
treatment significantly delayed loss of muscle strength and body
weight. This effect was observed within 7 days after treatment, and
persisted for 4–6 weeks. By 19 weeks of age, the strength preservation
was lost. In a similar manner, the drug also increased overall
survival of the mice by 10 days (ceftriaxone treated, 132 ^ 2 days
(all data with errors show mean ^ s.e.m.); saline control,
122 ^ 2 days; log rank, x2 1/4 7.8, P . 0.005; Wilcoxon x2 1/4 7.5,
P . 0.006) (Fig. 4e). This effect is typical of drugs given relatively
late in the life of G93A SOD1 mice, when the first clinical signs of
disease are evident, and thus even a small effect may have clinical
significance. When the same dose of drug was administered somewhat
earlier, at 6 weeks of age, survival was also increased (ceftriaxone
treated, 135 ^ 2 days, n 1/4 20; saline treated 122 ^ 1.9 days,
n 1/4 20), although not significantly better than late delivery at
90 days of age. The lack of greater efficacy when given earlier
would be consistent with the observation that the loss of GLT1
expression does not begin to occur until around 90 days in this
model.
Figure 3 b-Lactam induces transporter promoter activation and protein expression in vivo.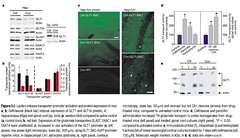
a, b, Ceftriaxone (black bar) induces expression of GLT1 and GLT1b protein, in
hippocampus (Hipp) and spinal cord (sp. cord) (a, western blot) compared to saline control
(a, control (con); b, red bar). Expression of the glutamate transporters GLAST, EAAC1 and
EAAT4 were unaffected. c, Increased in vivo activation of the GLT1 promoter (c, left
panels, low power light microscopy; scale bar, 200mm), using GLT1 BAC-eGFP promoter
reporter mice, in hippocampal CA1 astrocytes (asterisks; c, right panel, confocal
microscopy; scale bar, 50mm) and neuropil but not CA1 neurons (arrows) from drugtreated
mice, compared to untreated control mice. d, Ceftriaxone and penicillin
administration increased 3H-glutamate transport in cortex homogenates from drugtreated
mice (left panel) and treated spinal cord cultures (right panel). *P , 0.05
compared to untreated control. e, Immunoblots of total (T), intracellular (I) and biotinylated
fractions (M) of mixed neuron/glial cortical cultures treated for 7 days with ceftriaxone (cef,
100mM). Molecular weight markers in kDa. In b, d, data are mean+s.e.m.
To determine if ceftriaxone altered cellular neurodegeneration
in vivo, G93A mice were treated with ceftriaxone starting at 70 days
of age. Two weeks of drug therapy lead to a significant prevention of
motor neuron loss (Fig. 4h, i) and reduction of hypercellular gliosis
compared to saline-treated control G93A mice. GLT1 expression
decreases around the onset of clinical disease24, yet ceftriaxone
administration was able to increase endogenous GLT1 expression
significantly in spinal cords from the chronically treated mice
(Fig. 4f–h). The neuroprotection seen in this study was not likely
to be due to the normal antibiotic properties of the drug, because
ALS mice are not septic and do not have lung infections at 12–16 weeks of age—when prominent muscle strength effects were
seen. In addition, the use of other CNS-penetrating antibiotics
when given at this late stage (12 weeks old) do not prevent loss of
muscle strength (for example, minocycline; L.I.B. and J.D.R.,
unpublished observations).
b-Lactam antibiotics, first identified with the discovery of penicillin
in 1928, are now the most widely used antibiotics, and are one
of the most important modern pharmaceuticals8.Notably, they have
no substantial toxic CNS actions at normal antibacterial doses. Our
studies document a new property of these antibiotics, and demonstrate
that b-lactams can activate the gene for a neurotransmitter
transporter. This is, to our knowledge, the first evidence of stimulatory
pharmaceutical modulation of the glutamate transporter,
and provides a new pathway for drug discovery and manipulation of
glutamate transmission in disease. The mechanism of this overexpression
appears to be activation of the genetic promoter for
GLT1, although the pathway for promoter activation is as yet
unknown.
Figure 4 In vitro and in vivo neuroprotection by ceftriaxone. a, Oxygen glucose deprivation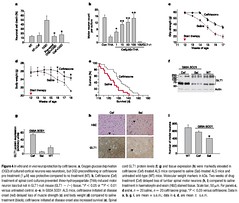
(OGD) of cultured cortical neurons was neurotoxic, but OGD preconditioning or ceftriaxone
pre-treatment (1mM) was protective compared to no treatment (NT). b, Ceftriaxone (Cef)
treatment of spinal cord cultures prevented threo-hydroxyaspartate (THA)-induced motor
neuron loss but not in GLT1-null mouse (GLT1 2 /2) tissue. *P , 0.05 or **P , 0.01
versus untreated control. c–e, In G93A SOD1 ALS mice, ceftriaxone initiated at disease
onset (red) delayed loss of muscle strength (c) and body weight (d) compared to saline
treatment (black); ceftriaxone initiated at disease onset also increased survival (e). Spinal
cord GLT1 protein levels (f, g) and tissue expression (h) were markedly elevated in
ceftriaxone (Cef)-treated ALS mice compared to saline (Sal)-treated ALS mice and
untreated wild-type (WT) mice. Molecular weight markers in kDa. Two weeks of drug
treatment (Cef) delayed loss of lumbar spinal motor neurons (h, i) compared to saline
treatment in haematoxylin and eosin (H&E) stained tissue. Scale bar, 50mm. For panels c,
d and e, n 1/4 20 saline, n 1/4 20 ceftriaxone group. *P , 0.05 versus ceftriaxone. Data in
a, b, g, i, are mean þ s.e.m.; data in c, d, are mean ^ s.e.m.
----
Methods
Screening assay and protein expression
Organotypic cultures were prepared from postnatal day 9 rat lumbar spinal cords11. Slice
cultures were maintained on Millicell-CM 30-mm inserts (5 slices per insert; Millipore,
PICM 03050) in 35-mm six-well plates (Falcon no. 3046) containing 1 ml growth media,
without antibiotics, and maintained in a humidified atmosphere of 5% CO2. After 7 days
in vitro, cultures were treated with the NINDS Custom Collection (MicroSource
Discovery) drugs at a concentration of 100mM for 7 days.Media and drugs were changed
biweekly. GLT1 was quantified by slot blot (5mg protein per slot). Protein concentration in
tissue sonicates was determined using Coomassie Plus protein assay (Pierce no. 1856210).
GLT1, GLAST, EAAC1 and EAAT4 protein were detected using primary rabbit polyclonal
rat anti-carboxy-terminal GLT-1 antibody followed by chemiluminescence (SuperSignal
West Pico Chemiluminescent Substrate (Pierce no. 34080) detection (BioRad VersaDoc,
Quantity One Discovery Series software,v4.3.0)). Twenty-one compounds were selected
for retesting at 10–100mM to confirm hits (.300% of control). These compounds were
also screened in a six-point dilution series with a maximum concentration of 300mM.
These dilutions were created from freshly prepared 10mM stocks in DMSO.
Concentrations required to achieve 50% of the maximally achievable effect for each
compound (EC50) were calculated using SigmaPlot (Ver 9; Systat).
Human GLT1 promoter reporter assay
GLT1 promoter activity was studied in normal human fetal astrocytes seeded at
1 £ 105 cells per 35-mm plate. Twenty-four hours after seeding, cells received the indicated
compound at a final concentration of 1–10mM or were left untreated (control). Fortyeight
hours later, the cells were transfected (calcium phosphate precipitation method7)
with a pGL3/GLT1 luciferase reporter construct (5mg) plus a pSVb-galactosidase
construct (1mg). In some cases, human fetal astrocytes or COS7 cell lines transfected with
the GLT1 promoter (2.7 kb) luciferase/eGFP construct were used. After an additional 48 h,
cell lysates were prepared and luciferase activity was determined using the Luciferase Assay
System Kit (Promega, E1501) and luminescence determined using a luminometer (Turner
Designs, TD20/20)7. Data presented is the average of three independent plates ^ s.d.
GLT1 activity and immunoblotting
Levels of GLT1 protein were quantified by immunoblots3. Functional glutamate transport
was measured by accumulation of 3H-glutamate in spinal cord slice or crude cortical
synaptosomal membranes25. Measurement of total glutamate uptake actually reflects the
combined physiological activity of all transporter subtypes. GLT1 protein is uniquely
sensitive to transport inhibition by dihydrokainate (DHK). To estimate the contribution
of GLT1 to transport, aliquots of tissue homogenates were also incubated with 300mM
DHK. Non-specific uptake was determined in the presence of 300mM threo-bhydroxyaspartate
(THA), at 0 8C and in sodium-free homogenates.
Generation of GLT1 BAC eGFP transgenic mouse
The BAC transgenic mice were generated as described previously26 with a shuttle vector
provided by N. Heintz. The BAC clone included approximately 45 kb upstream of the first
GLT1 exon, the full GLT1 coding region (123 kb) and 24 kb downstream of the last exon.
EGFP cDNA was inserted into the GLT1 start codon.
Oxygen glucose deprivation/ischaemic preconditioning
Primary corticalmixed neuronal-glial cell cultures were prepared from rodent fetal cortex
(gestation day 14–16 CD1 mice) using the paradigm of ischaemic preconditioning18.
Motor neuron toxicity
Neuroprotection in spinal cord organotypic cultures prepared from postnatal day 8–9
wild-type rat or GLT1-null mouse tissue was performed as described previously11.
Ceftriaxone was added for 5–7 days before the addition of 100mM THA or DL-threo-bbenzyloxyaspartate,
(TBOA) 100mM. Surviving motor neurons were counted 2–3 weeks
later by staining for phosphorylated neurofilaments (SMI-32).
G93A SOD1 mouse—disease onset and survival
Male transgenicmice expressing the human G93A SOD1 (B6SJL-TgN(SOD1-G93A)1Gur,
high expressor) were bred with background-matched B6SJL wild-type females (Jackson
Laboratories). The progeny were genotyped and used for subsequent studies. Experiments
were conducted at Psychogenics (Hawthorne, New York) in accordance with protocols
approved by the Johns Hopkins Animal Care and Use Committee. Mice were assessed by
daily observation for survival, and by weekly weighing and testing of grip strength starting
at 12 weeks of age22,23. All experiments were performed blinded with coded syringes for
injection.
Histology and motor neuron counts
Mice were perfused via cardiac infusion with 4% buffered paraformaldehyde and spinal
cord post fixed with the same solution. The lumbar enlargement was collected, paraffin
embedded, and serially sectioned at 14mm, for a total of 140 sections. Every seventh
section was stained with haematoxylin and eosin, and examined at 20 £ for motor neuron
identification and counting22. Images were acquired using the Zeiss LSM 510 Meta
confocal microscope (argon laser setting at 488 nm) with the operator blinded to
treatment groups. All images were captured with the same gain, offset, pinhole diameter
(2.53 Airy units), and scan speed (12.8ms with scan averaging set to 2). Z-series images
were collected at 1.03mm intervals.
Statistics
Quantitative differences between in vitro and in vivo drug effects were analysed by analysis
of variance (ANOVA) or Students t-test. Survival analysis was performed by Kaplan-Meier
analysis. Software for statistics included Statview, and JMP 5.1 (SAS Software).
Received 11 July; accepted 4 November 2004; doi:10.1038/nature03180.
1. Rothstein, J. D. et al. Knockout of glutamate transporters reveals a major role for astroglial transport
in excitotoxicity and clearance of glutamate. Neuron 16, 675–686 (1996).
2. Danbolt, N. C. Glutamate uptake. Prog. Neurobiol. 65, 1–105 (2001).
3. Rothstein, J. D., Van Kammen, M., Levey, A. I., Martin, L. J. & Kuncl, R. W. Selective loss of glial
glutamate transporter GLT-1 in amyotrophic lateral sclerosis. Ann. Neurol. 38, 73–84 (1995).
4. Rao, V. L. et al. Antisense knockdown of the glial glutamate transporter GLT-1, but not the neuronal
glutamate transporter EAAC1, exacerbates transient focal cerebral ischemia-induced neuronal
damage in rat brain. J. Neurosci. 21, 1876–1883 (2001).
5. Ye, Z. C., Rothstein, J. D. & Sontheimer, H. Compromised glutamate transport in human glioma cells:
reduction-mislocalization of sodium-dependent glutamate transporters and enhanced activity of
cystine-glutamate exchange. J. Neurosci. 19, 10767–10777 (1999).
6. Sepkuty, J. P. et al. A neuronal glutamate transporter contributes to neurotransmitter GABA synthesis
and epilepsy. J. Neurosci. 22, 6372–6379 (2002).
7. Su, Z. Z. et al. Insights into glutamate transport regulation in human astrocytes: cloning of the
promoter for excitatory amino acid transporter 2 (EAAT2). Proc. Natl Acad. Sci. USA 100, 1955–1960
(2003).
8. Goodman, L. S., Hardman, J. G., Limbird, L. E. & Gilman, A. G. Goodman & Gilman’s The
Pharmacological Basis of Therapeutics (McGraw-Hill Medical Pub. Division, New York, 2001).
9. Tanaka, K. et al. Epilepsy and exacerbation of brain injury in mice lacking the glutamate transporter
GLT-1. Science 276, 1699–1702 (1997).
10. Watase, K. et al. Motor discoordination and increased susceptibility to cerebellar injury in GLAST
mutant mice. Eur. J. Neurosci. 10, 976–988 (1998).
11. Rothstein, J. D., Jin, L., Dykes-Hoberg, M. & Kuncl, R. W. Chronic inhibition of glutamate uptake
produces a model of slow neurotoxicity. Proc. Natl Acad. Sci. USA 90, 6591–6595 (1993).
12. Chandrasekar, P., Rolston, K., Smith, B. & LeFrock, J. Diffusion of ceftriaxone into the cerebrospinal
fluid of adults. J. Antimicrob. Chemother. 14, 427–430 (1984).
13. Nau, R. et al. Passage of cefotaxime and ceftriaxone into cerebrospinal fluid of patients with
uninflamed meninges. Antimicrob. Agents Chemother. 37, 1518–1524 (1993).
14. Kazragis, R., Dever, L., Jorgensen, J. & Barbour, A. In vivo activities of ceftriaxone and vancomycin
against Borrelia spp. in the mouse brain and other sites. Antimicrob. Agents Chemother. 38, 2632–2636
(1996).
15. Chen, W. et al. Expression of a variant form of the glutamate transporter GLT1 in neuronal cultures
and in neurons and astrocytes in the rat brain. J. Neurosci. 22, 2142–2152 (2002).
16. Schlag, B. D. et al. Regulation of the glial Naþ-dependent glutamate transporters by cyclic AMP
analogs and neurons. Mol. Pharmacol. 53, 355–369 (1998).
17. Guo, H. et al. Increased expression of the glial glutamate transporter EAAT2 modulates excitotoxicity
and delays the onset but not the outcome of ALS in mice. Hum. Mol. Genet. 12, 2519–2532 (2003).
18. Romera, C. et al. In vitro ischemic tolerance involves upregulation of glutamate transport partly
mediated by the TACE/ADAM17-tumor necrosis factor-alpha pathway. J. Neurosci. 24, 1350–1357
(2004).
19. Spalloni, A. et al. Cu/Zn-superoxide dismutase (GLY93 ! ALA) mutation alters AMPA receptor
subunit expression and function and potentiates kainate-mediated toxicity in motor neurons in
culture. Neurobiol. Dis. 15, 340–350 (2004).
20. Canton, T. et al. RPR 119990, a novel alpha-amino-3-hydroxy-5-methyl-4-isoxazolepropionic acid
antagonist: synthesis, pharmacological properties, and activity in an animal model of amyotrophic
lateral sclerosis. J. Pharmacol. Exp. Ther. 299, 314–322 (2001).
21. Rothstein, J. D. & Kuncl, R.W. Neuroprotective strategies in a model of chronic glutamate-mediated
motor neuron toxicity. J. Neurochem. 65, 643–651 (1995).
22. Kaspar, B. K., Llado, J., Sherkat, N., Rothstein, J. D. & Gage, F. H. Retrograde viral delivery of IGF-1
prolongs survival in a mouse ALS model. Science 301, 839–842 (2003).
23. Drachman, D. B. et al. Cyclooxygenase 2 inhibition protects motor neurons and prolongs survival in a
transgenic mouse model of ALS. Ann. Neurol. 52, 771–778 (2002).
24. Howland, D. S. et al. Focal loss of the glutamate transporter EAAT2 in a transgenic rat model of SOD1
mutant-mediated amyotrophic lateral sclerosis (ALS). Proc. Natl Acad. Sci. USA 99, 1604–1609
(2002).
25. Rothstein, J. D., Martin, L. J. & Kuncl, R. W. Decreased glutamate transport by the brain and spinal
cord in amyotrophic lateral sclerosis. N. Engl. J. Med. 326, 1464–1468 (1992).
26. Gong, S., Yang, X. W., Li, C. & Heintz, N. Highly efficient modification of bacterial artificial
chromosomes (BACs) using novel shuttle vectors containing the R6Kgamma origin of replication.
Genome Res. 12, 1992–1998 (2002).
Supplementary Information accompanies the paper on www.nature.com/nature.
Acknowledgements We are grateful to J. Lee and C. Cocci for technical assistance; K. Tanaka for
GLT1-null mice; C. Leahy for ALS mouse studies; and J. Heemskerk for initiating the project,
discussions and encouragement. G93A SOD1 mice were provided by Project ALS. The work was
supported by the NIH, the Muscular Dystrophy Association and The Robert Packard Center for
ALS Research at Johns Hopkins.
Competing interests statement The authors declare competing financial interests: details
accompany the paper on www.nature.com/nature.
Correspondence and requests for materials should be addressed to J.D.R. (jrothste@jhmi.edu).
..............................................................
Nucleolar proteome dynamics
Jens S. Andersen1†, Yun W. Lam2†, Anthony K. L. Leung2*, Shao-En Ong1,
Carol E. Lyon2, Angus I. Lamond2 & Matthias Mann1
1Department of Biochemistry and Molecular Biology, Campusvej 55, DK-5230
Odense M, Denmark
2Wellcome Trust Biocentre, MSI/WTB Complex, University of Dundee, Dundee
DD1 4HN, UK
* Present address: Center for Cancer Research, Department of Biology, Massachusetts Institute of
Technology, Cambridge, Massachusetts 02139, USA
† These authors contributed equally to this work
............................................................................................................................................................................
The nucleolus is a key organelle that coordinates the synthesis
and assembly of ribosomal subunits and forms in the nucleus
around the repeated ribosomal gene clusters. Because the production
of ribosomes is a major metabolic activity, the function
of the nucleolus is tightly linked to cell growth and proliferation,
and recent data suggest that the nucleolus also plays an important
role in cell-cycle regulation, senescence and stress responses1–4.
Here, using mass-spectrometry-based organellar proteomics and
stable isotope labelling5, we perform a quantitative analysis of
the proteome of human nucleoli. In vivo fluorescent imaging
techniques are directly compared to endogenous protein changes
measured by proteomics. We characterize the flux of 489
endogenous nucleolar proteins in response to three different
metabolic inhibitors that each affect nucleolar morphology.
letters to nature
NATURE |VOL 433 | 6 JANUARY 2005 | www.nature.com/nature
© 2005 Nature Publishing Group
posted by brainhell at 11:55 AM
![]()

<< Home